New Managing Director for Bellona Norway
The Board of the Bellona Foundation has appointed former Minister of Climate and the Environment Sveinung Rotevatn as Managing Director of Bellona No...
News

Publish date: January 12, 2009
News
The table below shows the historical development of the amount of fish lost in the Norwegian salmon production. The figures represent the loss in number of individuals and the percentage loss of the total production.
| Loss in production |
Percent of production |
|
| 1994 |
9 798 000 | 9,0 |
| 1995 |
12 606 000 | 7,7 |
| 1996 |
15 706 000 | 11,6 |
| 1997 |
19 037 000 | 14,2 |
| 1998 |
27 184 000 | 9,4 |
| 1999 |
21 574 000 | 7,1 |
| 2000 |
19 773 000 | 6,0 |
| 2001 |
25 590 000 | 7,0 |
| 2002 |
33 376 000 | 8,4 |
| 2003 |
34 772 000 | 9,1 |
| 2004 |
28 327 000 | 7,4 |
| 2005 |
27 574 000 | 6,9 |
| 2006 |
34 618 000 | 7,7 |
| 2007 |
42 610 000 | 8,5 |

The Board of the Bellona Foundation has appointed former Minister of Climate and the Environment Sveinung Rotevatn as Managing Director of Bellona No...

Økokrim, Norway’s authority for investigating and prosecuting economic and environmental crime, has imposed a record fine on Equinor following a comp...

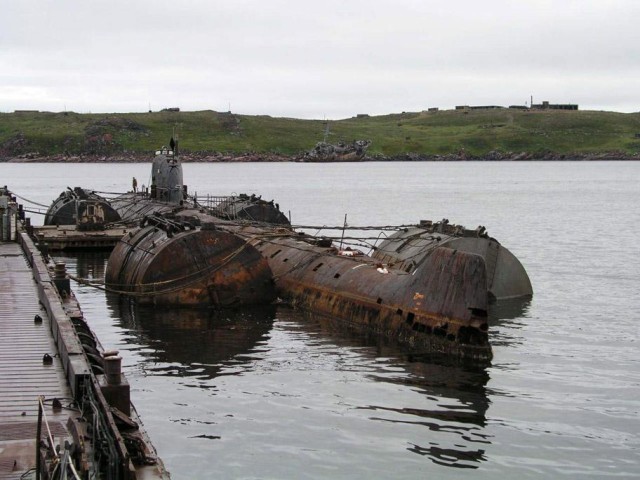
Our op-ed originally appeared in The Moscow Times. For more than three decades, Russia has been burdened with the remains of the Soviet ...

The United Nation’s COP30 global climate negotiations in Belém, Brazil ended this weekend with a watered-down resolution that failed to halt deforest...