
Not whether, but how fast on CO₂ storage in Norway
The following op-ed by Eivind Berstad, Bellona’s CCS team leader, originally appeared in Teknisk Ukbladet. When the European Free Trade Associatio...
News
Publish date: January 21, 2009
News
The number of escaped farmed fish serves as an indicator of the industry’s effort to handle this problem. Should one measure the environmental consequences of escapes, it is more appropriate to look at the volumes escaped fish to be found in important areas for wild salmon both in the river and at sea. The Norwegian Institute for Nature Research (NINA) analyse catches salmon on different locations in Norway. By using fish scales samples they can determine the number of farmed individuals in the catch. The following table shows the number of escaped farmed salmon in rivers, fjords and coastal areas.
| Year |
Stamfiske elv |
Sportsfiske elv |
Fjord |
Kyst |
| % | % | % | % | |
| 1989 | 35 | 7 | 14 | 45 |
| 1990 | 34 | 7 | 15 | 48 |
| 1991 | 24 | 5 | 10 | 49 |
| 1992 | 26 | 5 | 21 | 44 |
| 1993 | 22 | 5 | 20 | 47 |
| 1994 | 22 | 4 | 19 | 36 |
| 1995 | 29 | 5 | 17 | 39 |
| 1996 | 31 | 7 | 16 | 47 |
| 1997 | 29 | 9 | 32 | 47 |
| 1998 | 22 | 9 | 32 | 43 |
| 1999 | 15 | 6 | 30 | 36 |
| 2000 | 11 | 7 | 17 | 31 |
| 2001 | 11 | 7 | 16 | 30 |
| 2002 | 18 | 16 | 27 | 34 |
| 2003 | 13 | – | 13 | 22 |
| 2004 | 14 | 7 | 18 | 28 |
| 2005 | 13 | 6 | 16 | 31 |
| 2006 | – | 7 | 16 | 39 |
| 2007 | 13 | 9 | 26 | 34 |
The following op-ed by Eivind Berstad, Bellona’s CCS team leader, originally appeared in Teknisk Ukbladet. When the European Free Trade Associatio...
For the past eight years, disinformation has dominated news around elections all over the world. Despite this, it is still a widely misunderstood con...
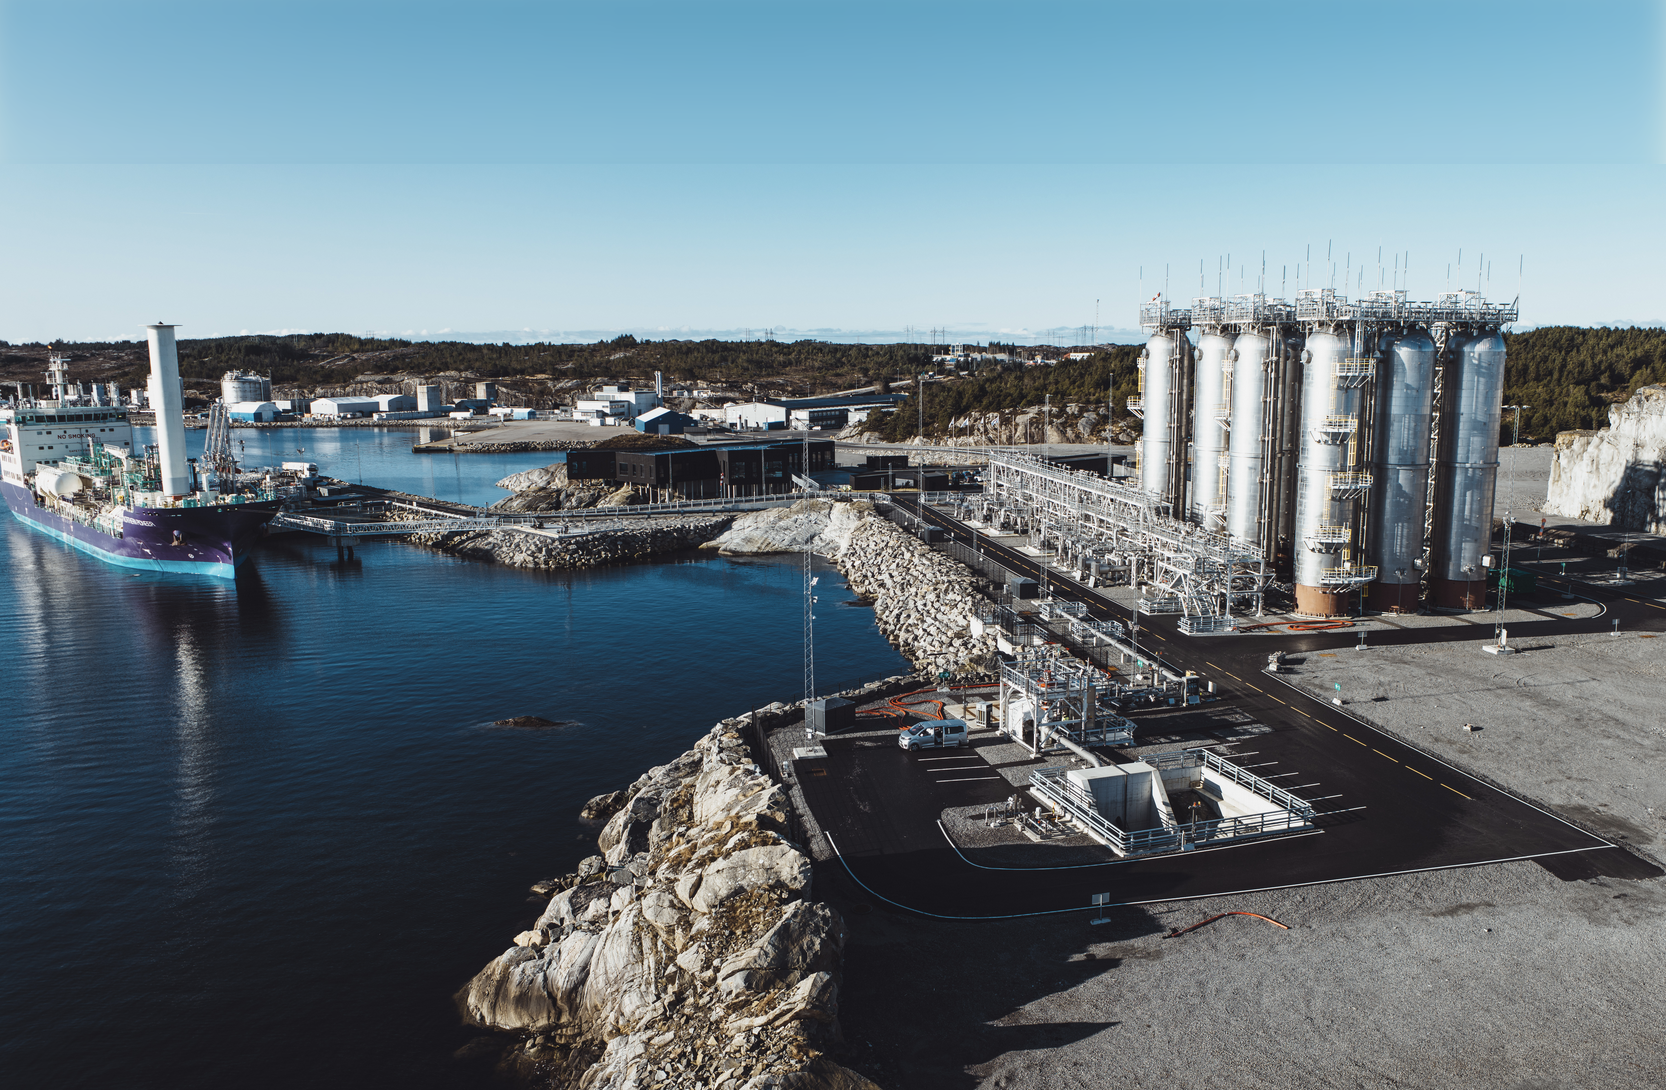
A ruling by the European Free Trade Association Court that Norway’s continental shelf falls under the European Economic Area Agreement could dramatic...
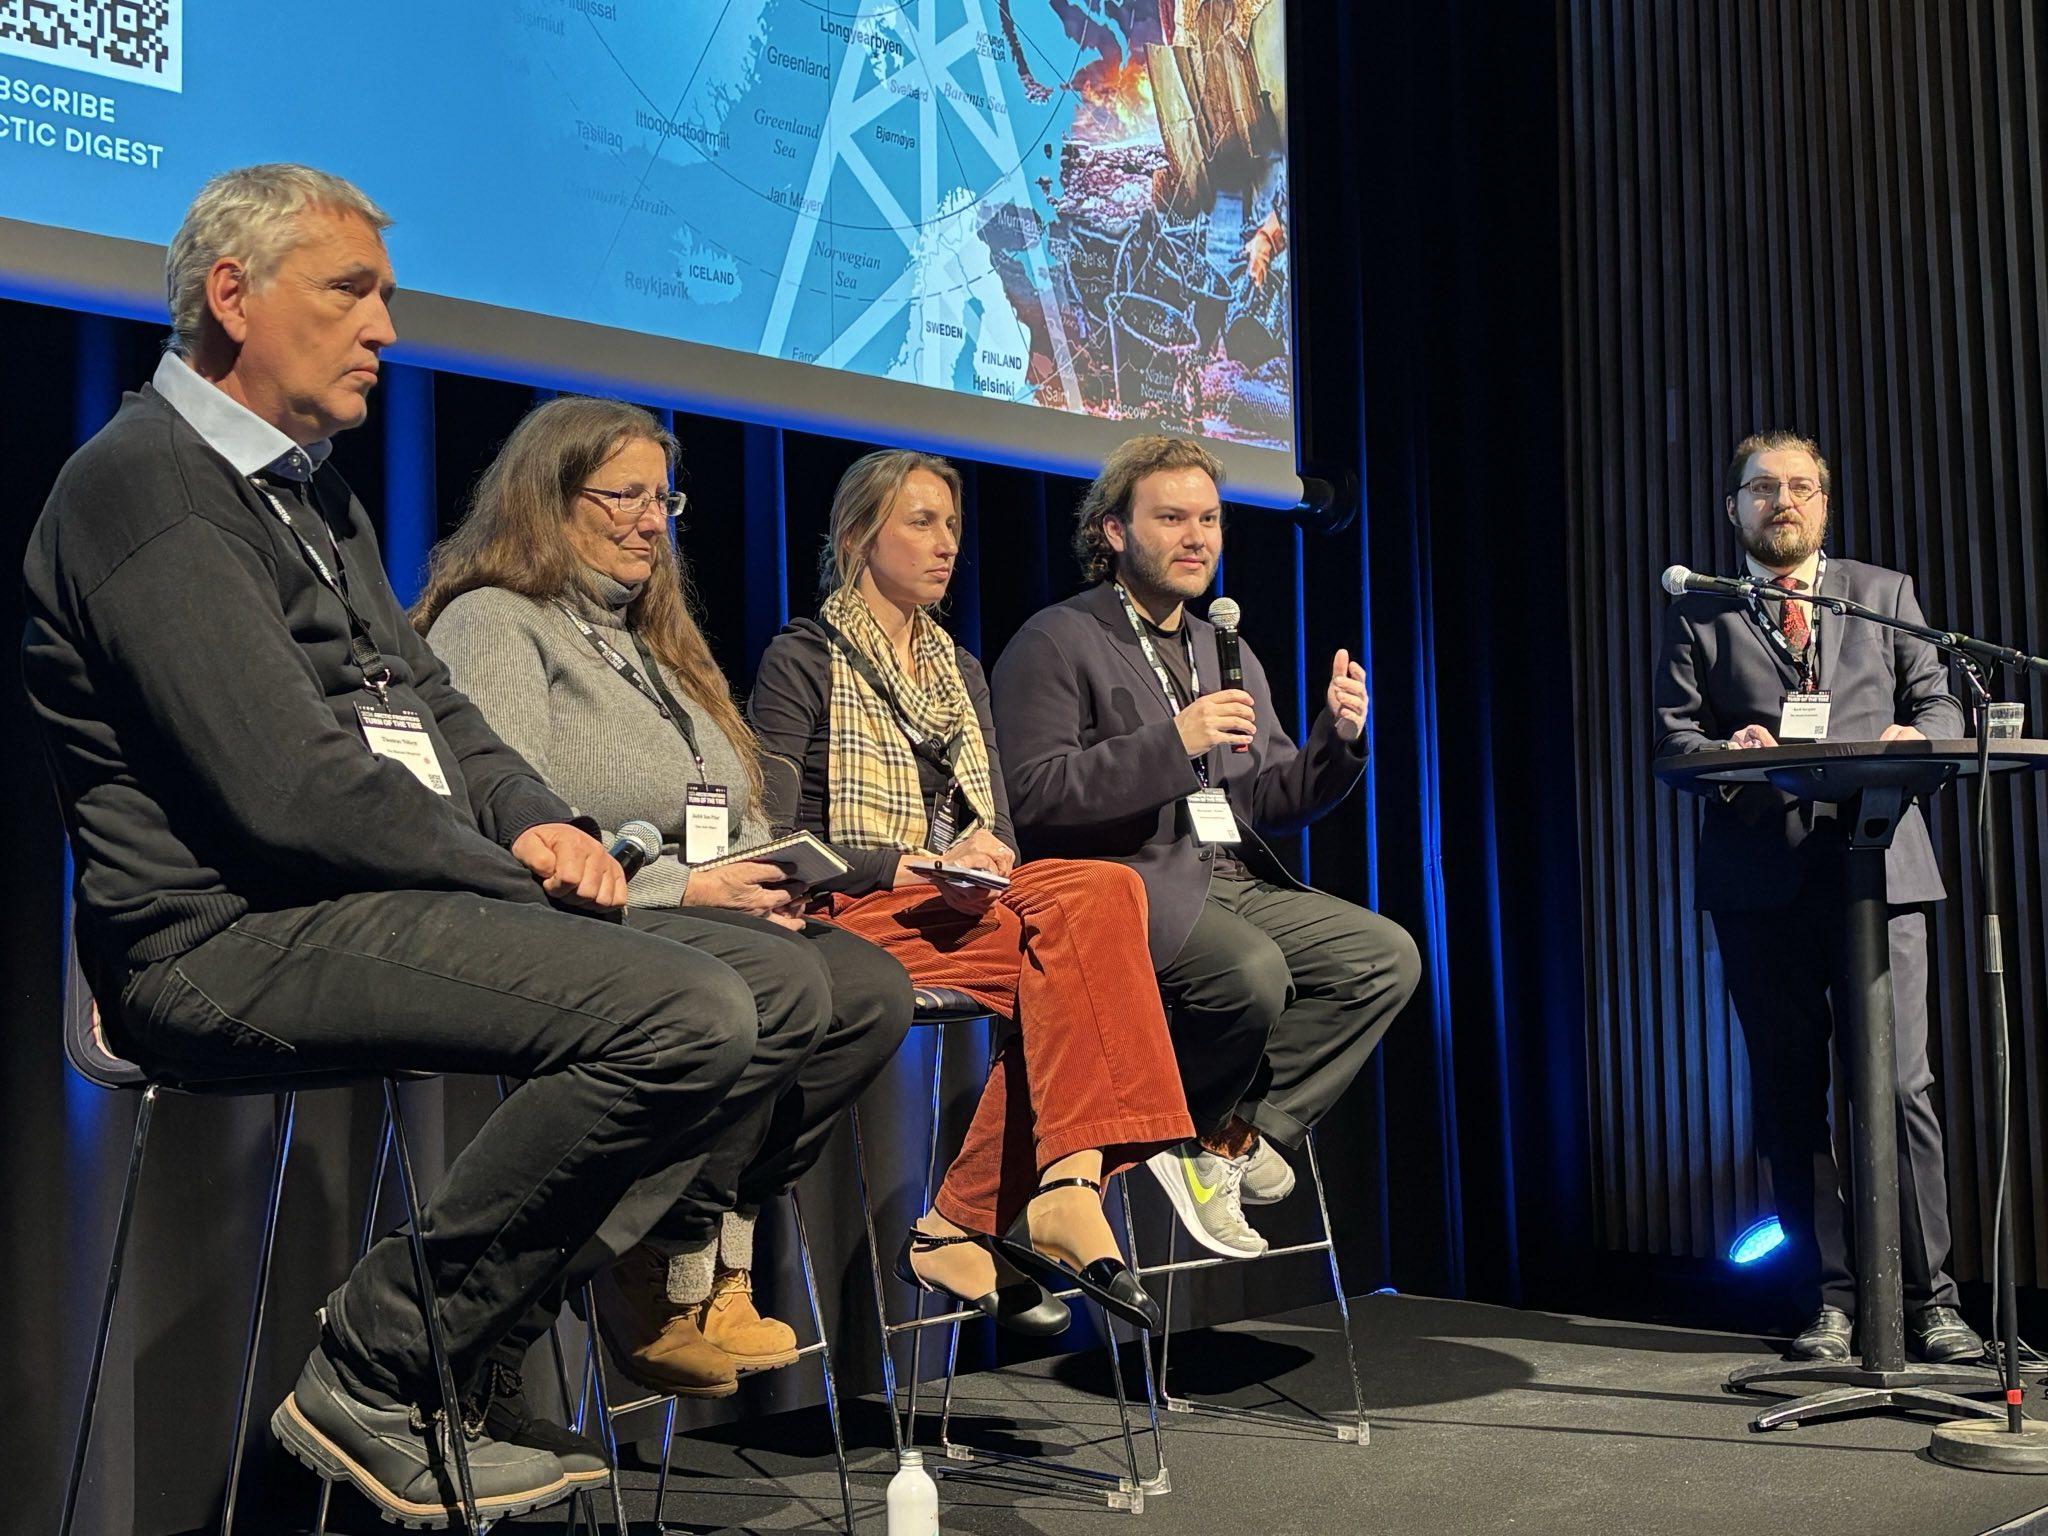
Bellona held a seminar on countering Russian disinformation in the Arctic at the Arctic Frontiers international conference in Norway