Arctic Frontiers: Disinformation, Security and the Northern Sea Route
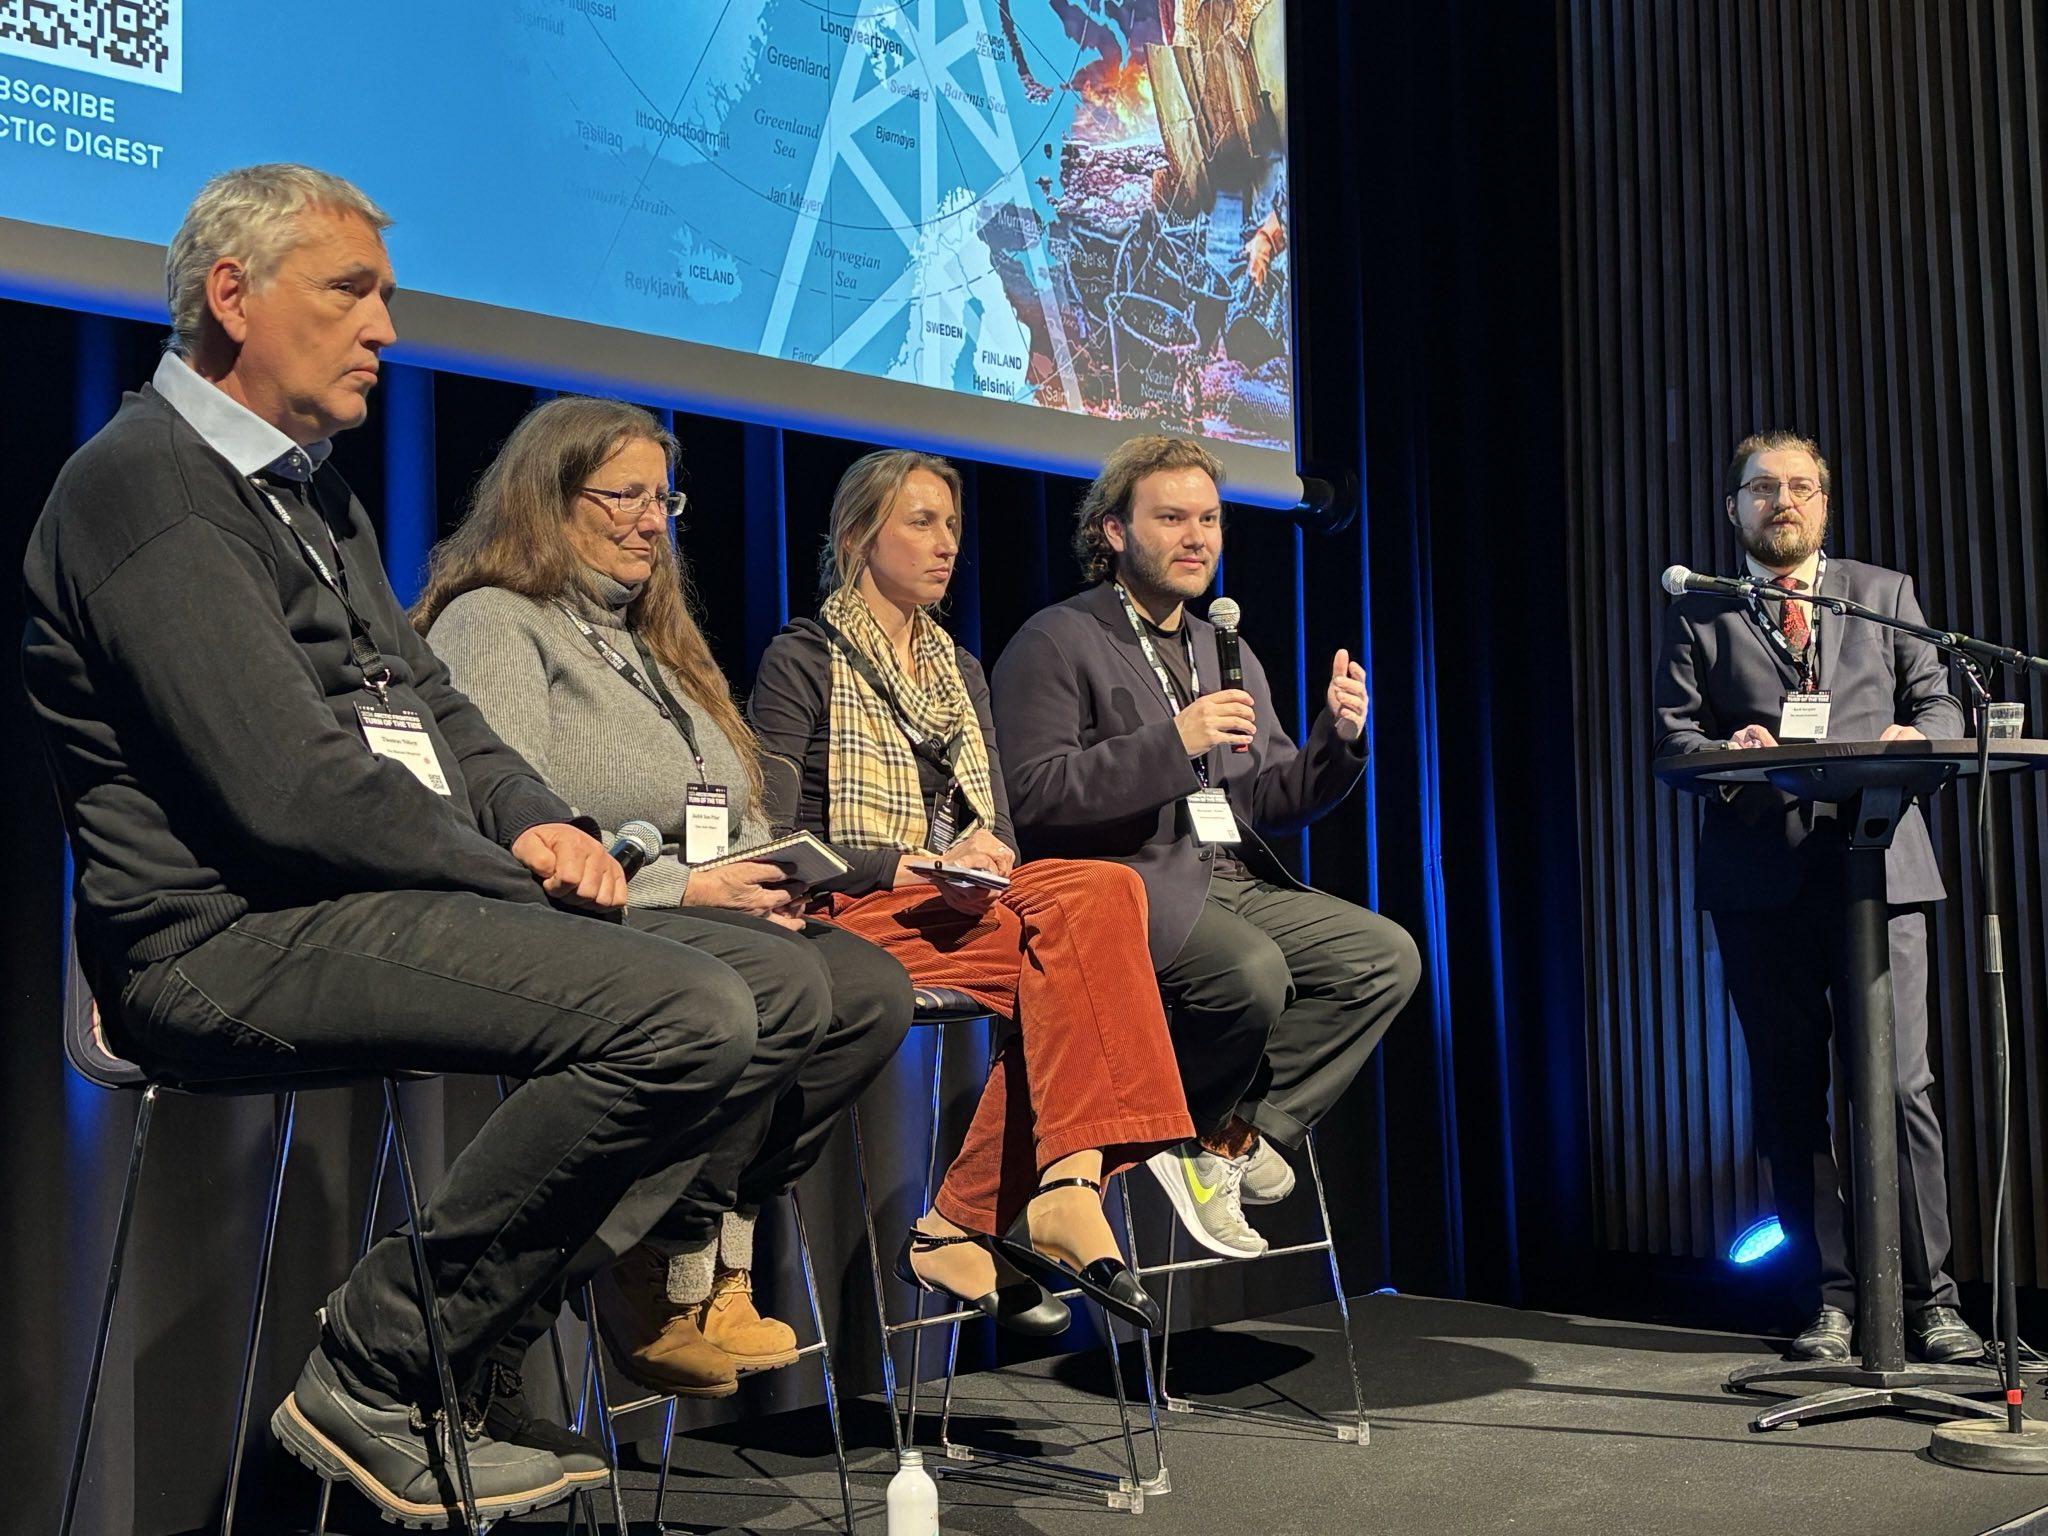
Bellona held a seminar on countering Russian disinformation in the Arctic at the Arctic Frontiers international conference in Norway
News

Publish date: April 19, 2023
Written by: Ksenia Vakhrusheva
Translated by: Charles Digges
News
A closer look at the structure of imports to the EU from Russia shows that some goods were not affected by the sanctions and the EU countries continued to buy them in 2022. Among them are:
By volume in monetary and natural terms, the largest part of imports is oil and gas. Following are fertilizers and metals nickel, copper and aluminum. The table shows the change in the volume of imports from Russia to the EU by main categories of goods. Lines with goods are highlighted, the volume of imports of which in physical terms increased in 2022 compared to 2021.
| Commodity | 2021 | 2022 | ||
| Billons of US Dollars | Thousands of tons | Billons of US Dollars | Thousands of tons* | |
| Crude oil | 57,02 | 114256,52 | 57,72 | 95814,61 |
| Petroleum products other than crude | 26,66 | 47220,43 | 37,68 | 41518,29 |
| Residual oil products and related materials | 3,52 | 7818,11 | 1,95 | 3758,14 |
| Natural gas, including liquefied | 25,64 | 49349,55 | 50,10 | 31126,75 |
| Coal (not agglomerated | 6,27 | 51127,92 | 6,32 | 25407,91 |
| Ingots and rolling molds from ferrous metals | 3,26 | 4477,58 | 2,63 | 3785,70 |
| Cast iron, spiegeleisen (compound of iron, carbon and manganese) and related materials | 1,33 | 2391,17 | 1,67 | 2813,43 |
| Aluminum | 2,62 | 979,27 | 2,96 | 936,50 |
| Copper | 2,90 | 309,60 | 2,94 | 320,54 |
| Nickel ore and concentrate | 1,41 | 101,13 | 1,91 | 114,43 |
| Nickel | 1,10 | 59,62 | 1,48 | 62,42 |
| Fertilizers (not natural) | 2,11 | 5379,95 | 2,70 | 4241,23 |
| Chemical elements, non-natural oxides | 1,31 | n/a | 1,45 | n/a |
| Silver and other platinum metals | 2,50 | 43 | 1,61 | 126,617* |
| Gems and precious stones | 2,12 | 251,14 | 1,44 | 210,172* |
*For the commodity groups “Silver and other platinum group metals” and “Pearls and (semi)precious stones”, a ton is used as a unit of measurement in physical terms. Source: https://comtradeplus.un.org/
The EU continues to be one of the main importers of fossil fuels of Russian origin even a year after the start of the Russian invasion of Ukraine. During the year of war and efforts to reduce Russian imports of hydrocarbons, EU countries managed to completely abandon only coal.
Thus far, there have been no restrictions imposed on the import of non-ferrous metals from Russia to the EU. In 2021, the EU imported 150,000 tons of nickel, and from January to November 2022, 144,000 tons. But even in the absence of official sanctions, some European companies began to independently abandon the products produce by Norilsk Nickel, a monopolist in the market for mining and production of nickel and palladium in Russia. In addition, Vladimir Potanin, the corporation’s CEO, has been placed on sanctions lists of the United States, Canada, Australia and the United Kingdom.
There have also been no sanctions imposed on the import of precious stones, nor on the Russian state company Alrosa, which is engaged in their extraction. According to Eurostat, last year the EU purchased Russian diamonds worth 1.4 billion euros.
Imports of aluminum and associated products from Russia to the EU actually increased in 2022 when compared to the previous year, jumping by 14 % to 2.8 billion Euro. The Russian aluminum monopoly Rusal has not been sanctioned by the EU, although its founder and head Oleg Deripaska is on US and UK sanctions lists. Despite the absence of official sanctions against the company, some large consumers, such as Boeing and Norsk Hydro, are refusing supplies from Rusal.
Copper imports from Russia to the EU in 2022 likewise did not decrease compared to 2021 and amounted to 2.8 billion euros. None of the three largest Russian copper producers, Norilsk Nickel, Ural Mining and Metallurgical Company and Russian Copper Company, are under EU sanctions.
Supporting the war — and pollution
The continued import of commodities from Russia not only indirectly finances Russian aggression in Ukraine, but also contributes to serious environmental pollution within Russia itself — which spreads beyond its borders and contributes to climate change.
A glance at the list of industrial facilities that have a negative impact on the environment — belonging to the 1st, highest hazard category — shows that a significant fraction of them are enterprises that manufacture products imported by the EU. The enterprises on this list constitute at least 60 % of Russia’s total pollution emissions.
Of the 300 enterprises comprising the list, 75 engage in oil and gas production and oil refining, 19 produce steel and other ferrous metal products, seven are aluminum industry facilities, five are copper facilities, four are mining and nickel production facilities, and 11 are chemical industry and fertilizer production sites.
According to the Russian State report on the state of the environment in 2021, emissions of pollutants into the atmosphere from stationary sources increased by 1.5% compared to the level of 2020 (16,951,500 tons) and amounted to 17,207,700 tons. tons. Over the past eight years, the level of emissions has not changed significantly. The discharge of wastewater into surface water bodies from processing industries in 2021 amounted to 2641.9 million m3, of which 65.3% are polluted; wastewater discharge from mining amounted to 1,394.2 million m3, of which 32.4% was polluted.
In 2021, 84.5% of all harmful air emissions from Russian enterprises came from ten industries. Energy companies traditionally emit the largest number of pollutants into the atmosphere (3.1 million tons of pollutants, or 17.8% of the emissions of enterprises that reported their emissions), in second place is oil and gas production (2.6 million tons, or 15.1%), the third is the extraction of metal ores (2.1 million tons, or 12.4%).
This is followed by coal mining (1.51 million tons, or 8.8%), transport enterprises and pipelines (1.5 million tons, or 8.7%), metallurgy (1.4 million tons, or 8.1%), production of coke and oil products (667 thousand tons, or 3.9%).
Surface and ground waters are also affected by pollution. According to the State Report, 4,506 sites of groundwater pollution have been identified. Pollution of 1,587 sites (35% of the total) is associated with the activities of industrial enterprises. The main substances polluting groundwater are nitrogen compounds (nitrates, nitrites, ammonia or ammonium, found at 1,944 sites), oil products (at 902 sites), sulfates and chlorides (at 670 sites), heavy metals (at 338 sites) and phenols (at 56 sites).
It is difficult to find publicly available statistics on individual types of production, but some companies have published reports, which, among other things, include data on emissions and discharge of pollutants.
For oil and gas production, such statistics are available in the State Report. In 2021, compared to 2020, gross emissions into the atmosphere decreased by 1.1% and amounted to 4.2 million tons of pollutants, which is 24% of the total emissions of pollutants from stationary sources. Most are carbon dioxide and methane. At the same time, the decrease in the volume of captured and neutralized substances amounted to 8.7%. Discharge of used water increased by 1.5% to 844 million m3, although water withdrawal decreased by 4.5%. The area of reclaimed land has decreased. The volume of generated waste increased by 6.5%. The number of accidents also increased from 14 in 2020 to 17 in 2021. As a result of accidents in 2021, 2,500 thousand m2 of the surface of water bodies and 7.3 hectares of land were affected.
The 2021 Sustainability Report produced by aluminum giant Rusal includes values for atmospheric emissions of pollutants in 2019, 2020 and 2021. The volume of emissions for this period increased from 348,000 tons to 368,900 tons. During the same period, emissions of carbon monoxide, sulfur dioxide and nitrogen oxides increased. The volume of hazardous waste generated over this period also failed to decrease. In 2019, these volumes amounted to 500,000 tons; in 2020, 800,000 tons, and in 2021, 700,000 tons.
The company claims that owing to the completion of a closed water circulation system at the Krasnoturinsk aluminum refinery, the volume of wastewater in 2021 decreased by 24.5% compared to 2020, amounting to 171.2 million m3 — 36% of which is polluted. At the same time, the total volume of water intake (178.4 million m3) did not decrease compared to the previous two years.
Data from the Norilsk Nickel Sustainability Report show a 16% decrease in polluting emissions in 2021 compared to the previous four years, amounting to 1,646,900 tons (or 9% of total emissions from stationary sources). The two main factors that reduced Norilsk Nickel’s emissions are the temporary suspension of mining and processing operations at the Polar Division and the implementation of a program to reduce sulfur dioxide emissions at the Kola Mining and Metallurgical Plant. Sulfur dioxide is the main pollutant, accounting for 97% of all of Norilsk Nickel’s air emissions.
The company’s wastewater volume, after a significant increase in 2020, slightly decreased in 2021 and amounted to 176.8 million m3. The volume of water intake fluctuates from year to year, but there is no notable decrease. In 2021, because of the company’s activities, 207 hectares of land were disturbed; as a result, the total area of disturbed lands amounted to 16,581 ha. Land reclamation has not been carried out. The volume of waste in 2021 increased by 7% compared to 2020 and amounted to 156.5 million tons.
As is well known, environmental pollution respects no borders, so pollutants entering the air or water in Russia migrate to neighboring countries. According to the State Report, the most common pollutants in water bodies on the border of the Russian Federation with neighboring states are:
Russian companies, both those that have fallen under direct sanctions, and those that have managed to avoid them, are now having a difficult time selling their goods, dealing with logistics and raising debt capital on international markets. This likely means that efforts to modernize production in order to reduce emissions and discharges will slow down or stop.

Bellona held a seminar on countering Russian disinformation in the Arctic at the Arctic Frontiers international conference in Norway

Our December Nuclear Digest, reported by Bellona’s Environmental Transparency Center, is out now. Here’s a quick taste of three nuclear issues arisin...

Bellona has launched the Oslofjord Kelp Park, a pilot kelp cultivation facility outside Slemmestad, about 30 kilometers southwest of Oslo, aimed at r...

Our November Nuclear Digest by Bellona’s Environmental Transparency Center is out now. Here’s a quick taste of just three nuclear issues arising in U...